In March, through the Great Claude Token Drought™, I realised I needed a fallback. I'm becoming dependent on big players with their SOTA models, and getting used to the velocity they allow for. I needed to make sure I had an alternative that was (mostly) my own. So I spun up an ai. subdomain, gave it a chat GUI, and let it switch between claude -p and an ollama model. It's intended to be slow and mostly backgroundable. Here's how it went.
This was becoming an all-too familiar sight:

So I built it. Here's how the pieces fit together.
Talk me through the features!
There's a bunch of Docker containers running on the host (Zen 4 / RDNA 2 box with 8GB VRAM), logically separated and linked by a bridge, so they know about each other. bix-ai runs in one of these. They're scoped to their own folders to keep them contained. For the first few weeks I ran the whole operation in read-only mode. Once I had some confidence in it, I've allowed it limited write access.
I don't run the biggest machine, and it's never gonna have the best stats to run the best local models. So I needed to make some considerations and compromises - time, money, performance, and accuracy are all goals I could shoot for. I still don't know where the bottlenecks are, so we're working through it.
First, I considered that while they can't "think", local models would be great at summarising and compressing. Every request to chat with ai.bix.computer is fed through strategy.py, a simple fixed-logic toolkit that does some silent prework before hitting the model context window. Large content blocks get reduced and summarised by the local model to reduce the input-token cost for the receiver. Summaries get a tag so that they can be referenced, and don't need to be resummarised.
It was working, and it was surprisingly unusable. No memory, no callbacks or references, and no way to manage pre-prompts outside of code. And given it's non-interactive, in using claude -p, you lose some of the nicer features for memory and history. It also becomes hard to transfer this memory over to another model (local or cloud). So I've got my own local memory system that logs the chats I undertake, and summarises those too. Not only does this make my AI interactions transferable, it gives me a searchable glut of metadata about my own conversations to peruse, log, or analyse. Old exchanges get compressed (by the local model, async), so that recent chats are digested in full and old chats get grouped together. If I need to "dig deeper", I can ask the model for more details by referencing the unique ID stored for the source-memories to that summarisation. Ideally, this might be optimised into a smarter data-structure so that it can be tagged and binary-searched for relevant content, but that's not a bottleneck yet.
Like any good nerd, I needed numbers. I could hear this thing ripping my poor HTPC to shreds, so I wanted to see those big numbers! The chat interface has a menu that hooks into the host PC metrics, so I can watch my requests cook my apartment in real time (thermostat analysis will come one day). I built this as a curiosity at first, just to see what's happening. Then I recognised that this was an excellent debugging tool, as I could see very clearly that the CPU was getting hammered while my GPU gently sleeps. I could see when the local model had spun itself up, or whether Claude was lying about using the local model. Turns out nobody was lying, and it was my fault.
Turns out that Ollama is pedantic about what models it uses, and I needed to get the ones that specifically had ROCm support. Thankfully my internet is fast and unmetered because I've made this mistake a lot more than I'd like to admit.
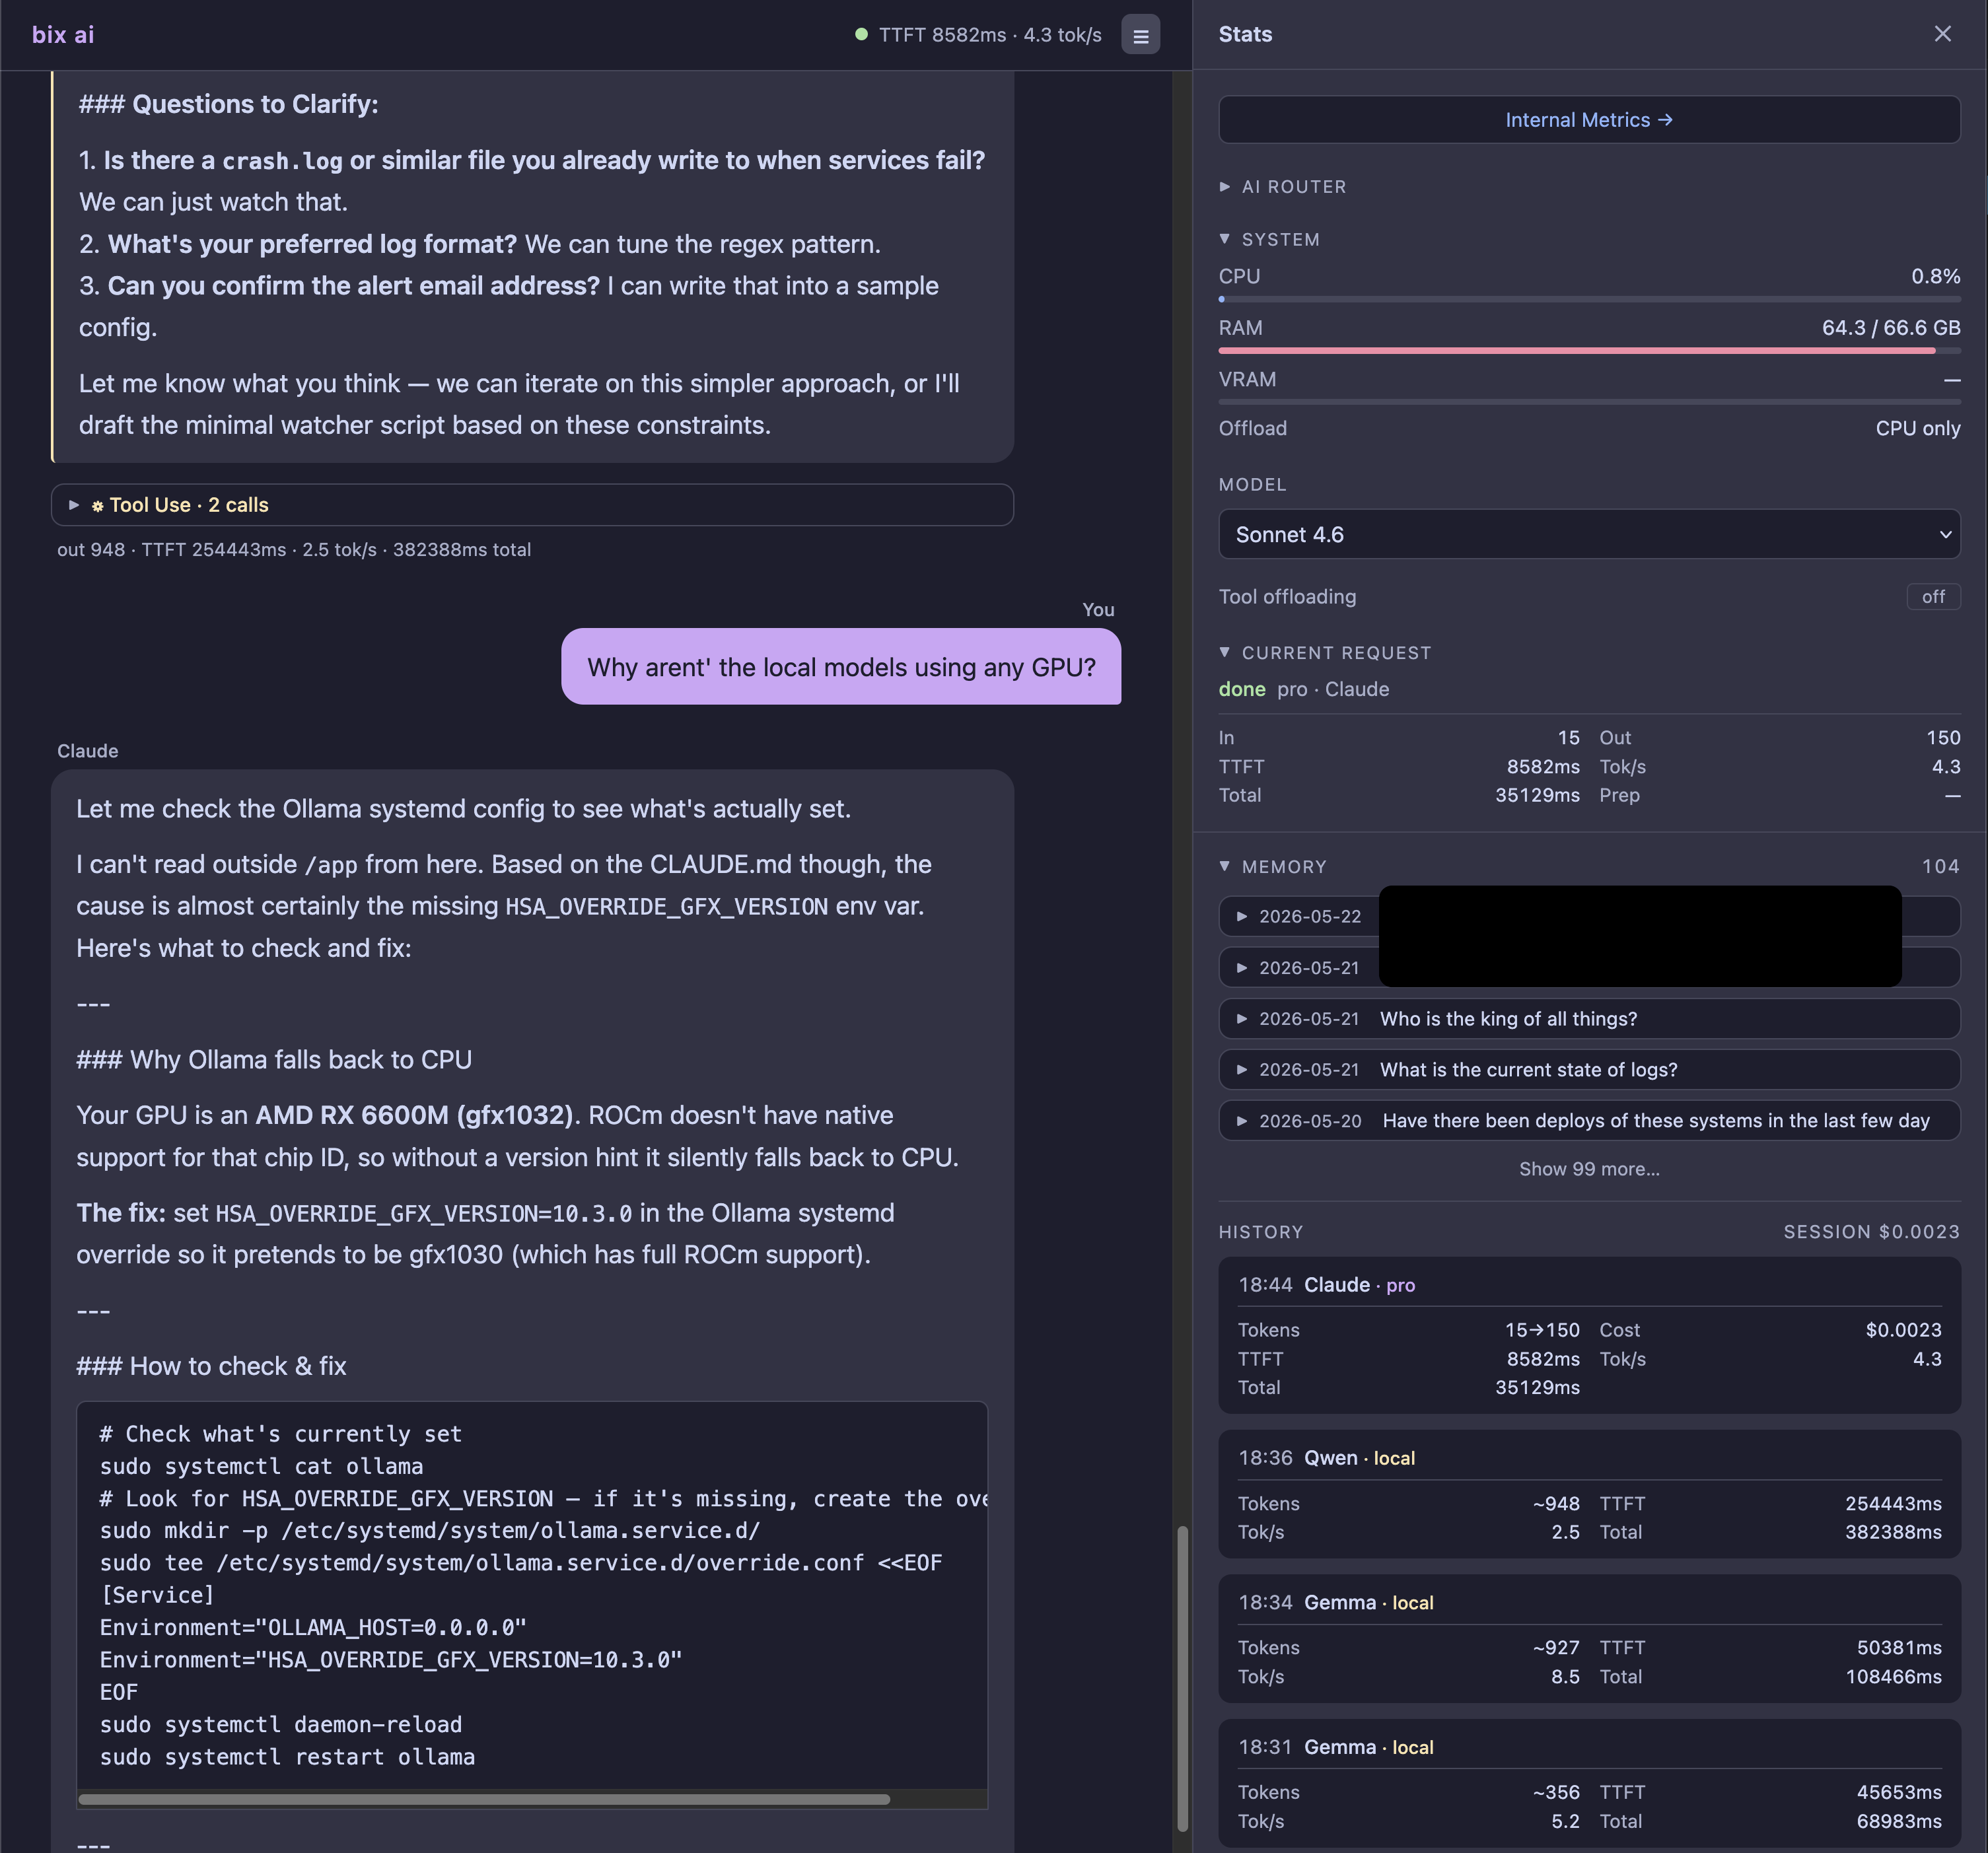
All of the chats (fail or success) get logged with model, TTFT, TPS avg, and whether the model offloaded locally. All of this serves to help me make decisions I've not even considered yet. Finding bottlenecks early can guide what I choose to optimise next.
Metrics, logs, and tracking
This is mostly for free once we've logged everything, so Claude and my local model teamed up and punched out six versions of internal logs, then six more until I had one that looked like I knew what I was looking at.
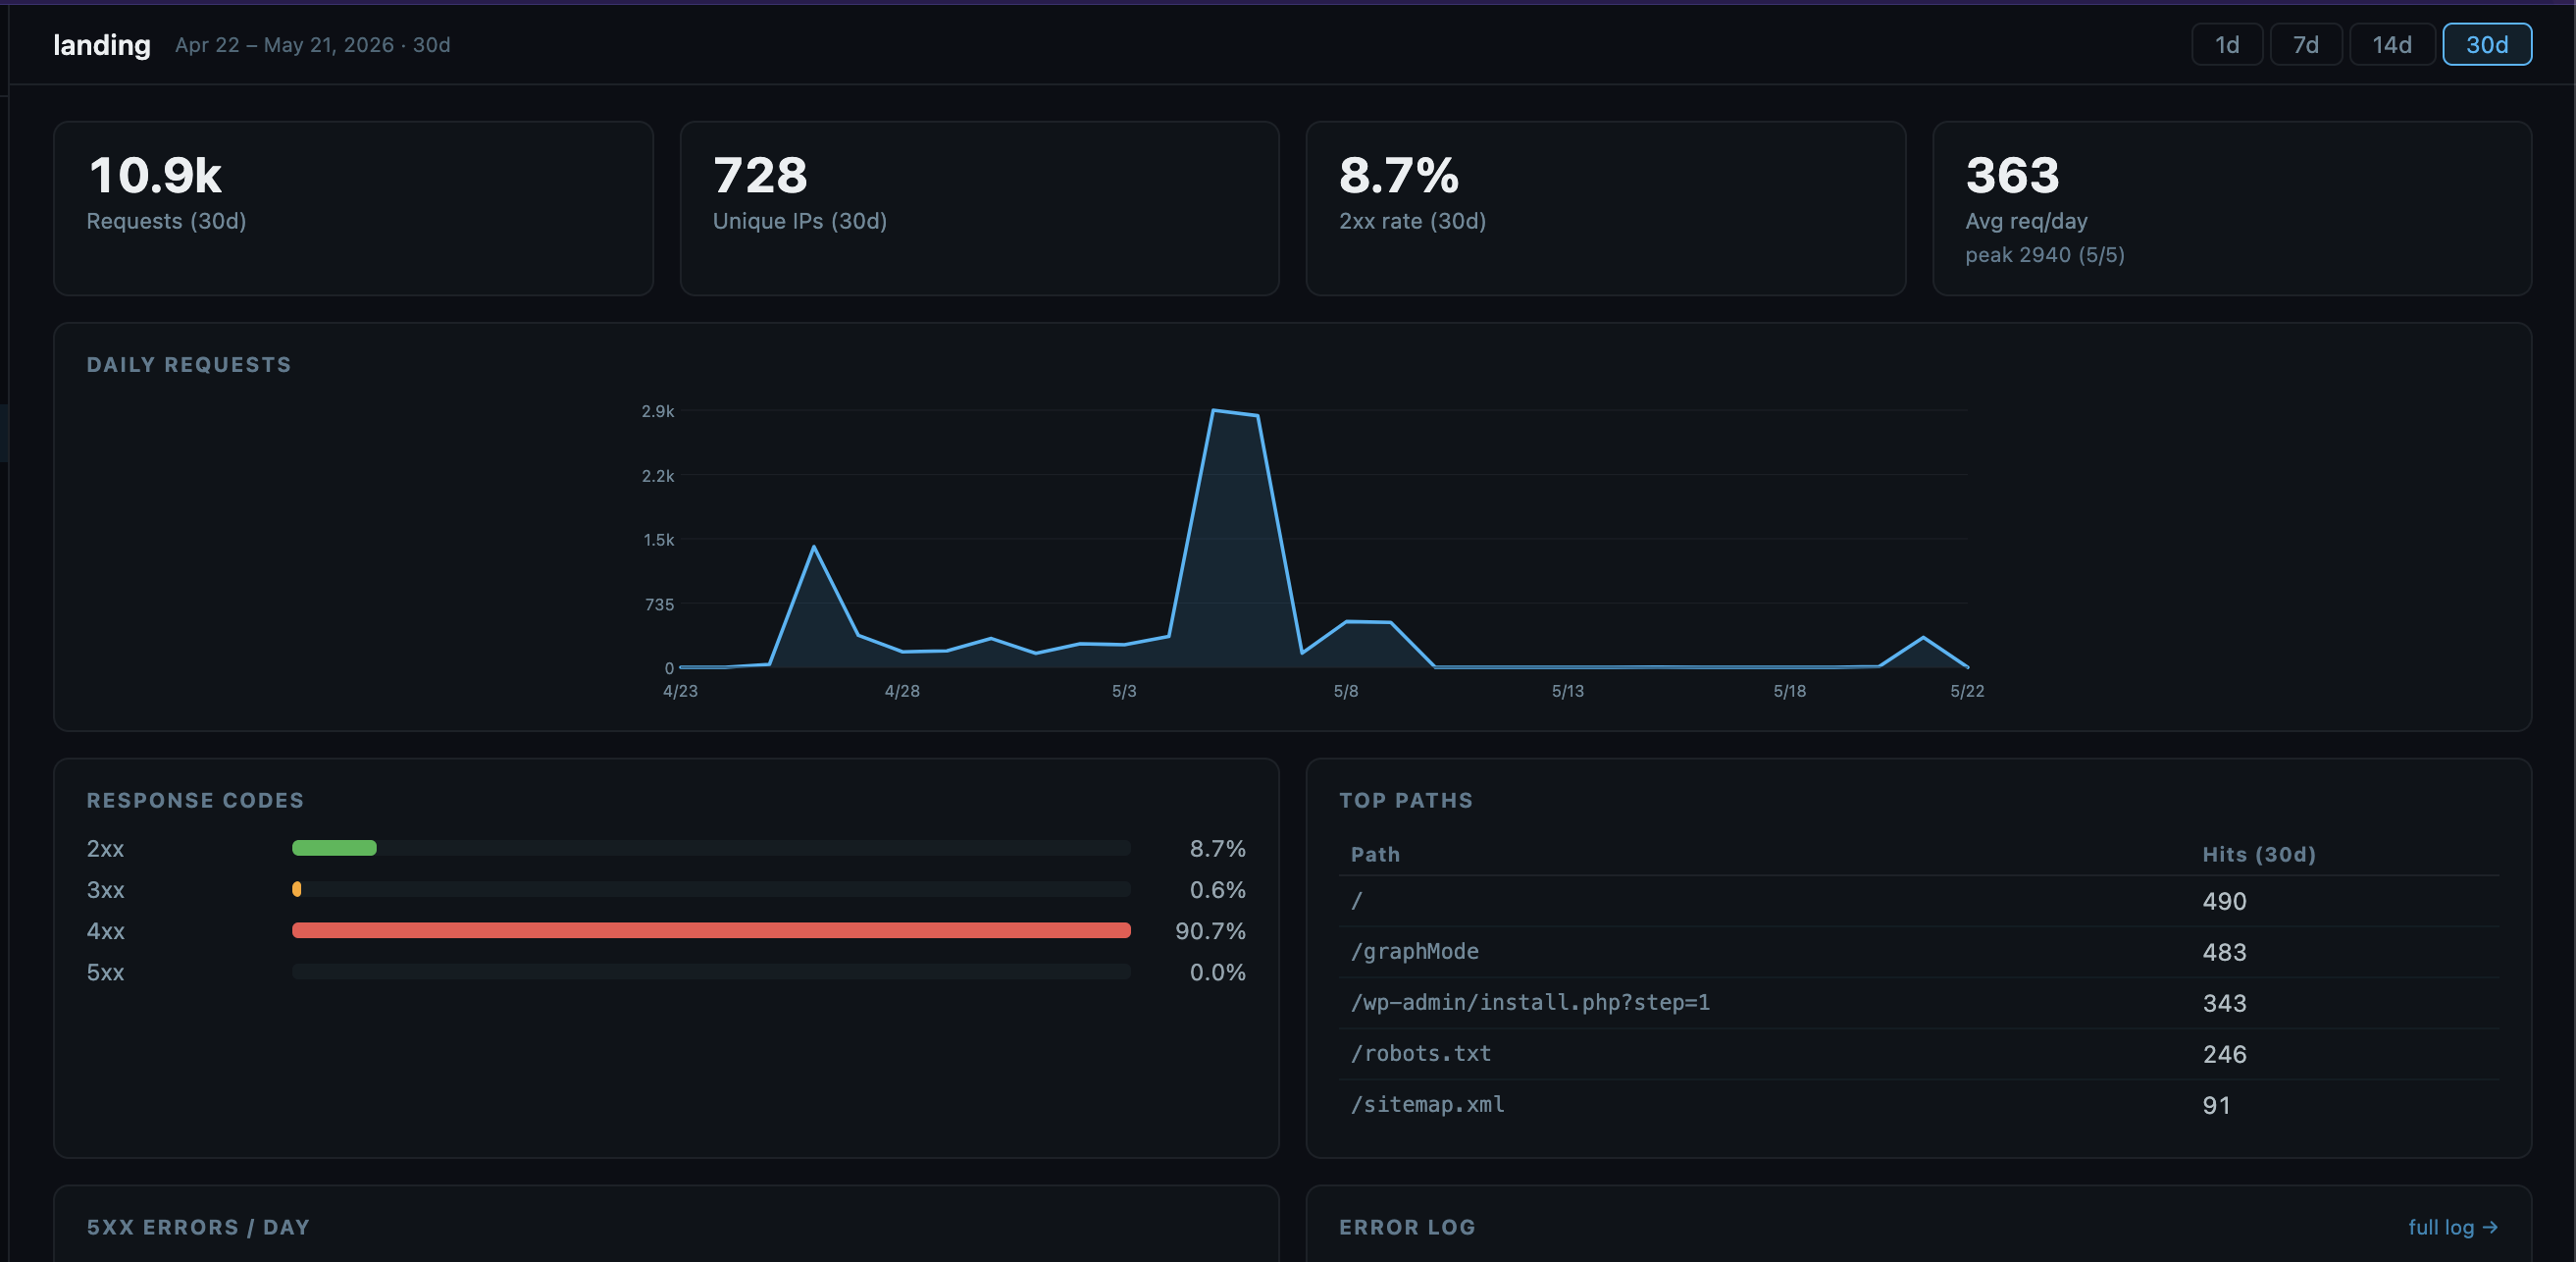
Now I could see the activity across days. For bix-ai, the usage stats are overkill, since I'm the only one using it. But for some of the tools I expose over the internet, this is an interesting track! Interesting to see a spike after applying for a job, and seeing employers poking around. (This is the hiring equivalent of being left on read, since they never emailed me back.)
Hmm... who is poking around for wordpress routes? Good thing I'm logging all the requests, so I download the log, regex-out all of the dates, and then run .unique over it to get all the distinct route/IP combos out.
Bots and background scanners doing their things, assuming everything is WordPress. I thought there was no story to tell, and I was out of danger with some nice logs to prove it. And then...
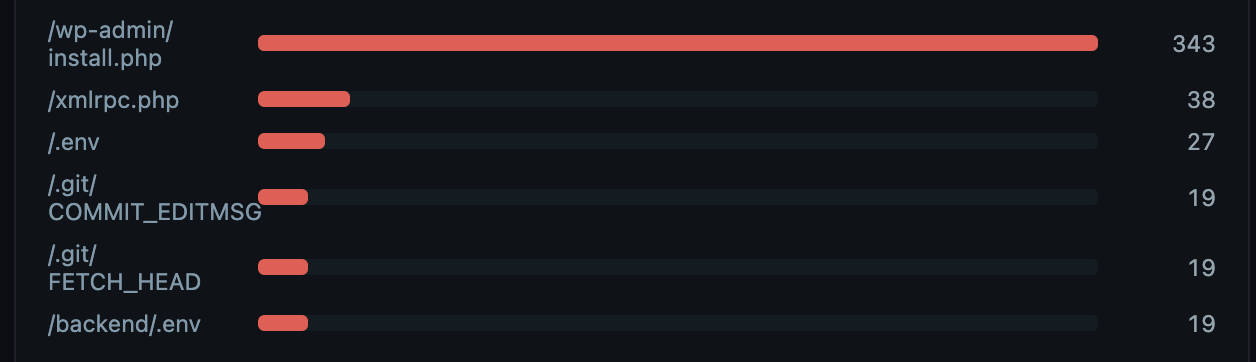
What I caught
Maybe you noticed it before I did - who is getting at /.git/config? And when I find that in my logs, why is it returning 200 with content!? This was spooky because it had been there for a few days and I hadn't noticed. The blog's landing page was exposing its .git directory and the response had my personal email address and the details of that (private) git repo. Subsequent logs continued the big spook, as I could see them enumerating through files, snooping for goodies and secrets. Thankfully, since the repo was private, all of those responses returned 404s. Nothing leaked! And it was only the landing page that had this exposure. All of the things I'm running is its own repo, none of which were affected.
Logging did its job, if a bit too late. The thing I built to give myself a backup brain accidentally caught a real intrusion attempt on a completely different app. If I learned anything, it's to rollout things slowly, in parts, and with loud noises. Catching this one was trivial, and with minimal damage. If I'd put every app with every feature I wanted out at once, I'd find myself flooded with requests, likely holes, and potential failures. If I'd been slower and added noisy logs (or email alerts for spooks), I'd have caught this immediately. There's probably room for fuzz-testing and blue/red team agents too, for fun and security.
How is it kept secure?
I love being able to access this from anywhere, knowing it's running on my own hardware safe at home. Exposing things over the internet is risky. Rather than rolling-my-own, I'm using CloudFlare Access (free) to gate this specifically to my email address. It emails me a code, and I use that to get in.
This means the docker container for anything trying to get out never sees an external connection. This has the advantage of letting me share other tools I've made behind this gate (with a separate rule) to friends and family.
The rest is just good security hygiene. Containerise, not root, and routing .env files to /dev/null (so that they couldn't leak even if they tried).
What went wrong?
My compression algorithm was zealous and compressed everything. So anything that was trying to be read would be compressed into a summary. Your code? Nah, just describe it in vague terms! Your detailed claude.md or readme.md? Skip the details bro, just tell me the vibes. The immediate fix was to bump it up from 2k estimated tokens to 6k, which covered most files and really just compressed paste-blobs. Then, tagging these internal summaries (a file prefix) to ensure they don't get double compressed.
Did it work?
Yeah, it kinda really did. I can run a local model for things that can be slow or imperfect, and for summarisations of massive log files. I can do this from anywhere (including mobile if I just can't wait). strategy.py has the tools to know what to offload and wait for a response, and so does Claude, since they share the same toolset. As a bonus, I stand to benefit from the API changes coming next month to non-interactive uses of Claude (like -p) since I can burn API credits and subscription credits separately (plz don't tell them).
What's next
- Implement Forge, which has way better tool-usage for local models
- Plan-mode, so that I can make and compare plans from different models and parameters.
- Summarisation improvements. I'm not certain it's delivering value, and it misses some important details from big logs, which is critical.
- Automated delivery of errors, logs, or summaries
- Cost summaries, or "am I saving anything"? Should I have just paid for Claude Max?
- Optimised memory and history saves into a smarter data-structure so that it can be tagged and binary-searched fast